
Let’s be honest, most SaaS founders love dashboards…right up until they realize half the numbers on them don’t actually matter.
You can build a beautiful analytics setup with dozens of charts and weekly “data reviews.” But if those numbers don’t influence decisions about growth, retention, or revenue, they’re just noise. And noise doesn’t scale a SaaS business.
The companies that break past $10M ARR don’t track everything; they track the right things. In this guide, we’ll skip the vanity metrics and focus on the 12 SaaS KPIs that actually tell you whether your product is growing, leaking customers, or quietly running out of runway.
What Are SaaS KPIs?
SaaS KPIs are the numbers that tell you whether your business is actually working. Think of them as the scoreboard for your SaaS company. They won’t magically tell you how to win, but they make it obvious when something is broken. If revenue growth slows, churn spikes, or acquisition costs climb, the right KPIs surface the problem fast.
In practice, SaaS KPIs track the core mechanics of your business: growth, revenue, retention, and efficiency. When you focus on the right ones, they don’t just explain what happened last month; they point directly to what needs fixing next.
The mistake most founders make? Tracking metrics that look impressive but change nothing. Vanity numbers might decorate an investor slide, but they won’t help you build a SaaS company that survives and scales in 2026.
Why SaaS KPIs Are So Important?
SaaS businesses run on recurring revenue, which means small shifts in customer behavior can have a massive long-term impact. Unlike traditional product companies that get paid once, SaaS companies depend on customers staying month after month. The right KPIs help you quickly spot whether your growth, revenue, and retention are moving in the right direction or quietly slipping.
And because SaaS moves fast, problems can escalate just as quickly. Customers can sign up in minutes, but they can also churn just as easily. Well-chosen KPIs act as early warning signals, helping you identify what’s working, fix what isn’t, and keep your team focused on the actions that actually drive sustainable growth.
SaaS KPIs vs. SaaS Metrics
Before diving deeper, it’s important to understand the difference between SaaS metrics and SaaS KPIs. They’re closely related, but they serve different purposes.
| Aspect | SaaS Metrics | SaaS KPIs |
|---|---|---|
| Definition | Raw data points that measure different parts of your business. | Strategic metrics are tied directly to business goals and performance. |
| Purpose | Provide visibility into what’s happening across your product, marketing, and sales. | Turn important metrics into targets that guide decisions and growth. |
| Example | Number of marketing qualified leads (MQLs) from a campaign. | Conversion rate shows how many of those leads became paying customers. |
| How They’re Used | Used for monitoring trends and collecting performance data. | Used for evaluating success and benchmarking against targets or competitors. |
| Business Impact | Helpful for understanding activity. | Critical for measuring progress toward revenue and growth goals. |
In short, metrics tell you what’s happening, while KPIs tell you whether it actually matters for your business.
Most Important SaaS KPIs You Need to Track
1. Total Number of Paid Customers
This one’s simple but dangerously easy to ignore. It’s the raw count of people actually giving you money for your product in a given period. Not free trial users. Not “maybe next quarter” leads. Actual paying customers.
Why does it matter? Because this number is the heartbeat of your revenue. If it’s growing, great, you’re selling. If it’s flat or shrinking, something’s broken, whether that’s in your sales process, product, or customer experience.
Track it religiously. When it moves, you’ll know if it’s because your sales tactics worked, your product got better, or your customer service made people stick around.
Total Number of Paid Customers = Number of customers who have purchased a product or service and completed payment within a specific period.
2. Total Number of Sign Ups
This is your front door traffic—the count of new users who’ve raised their hand and said, “I’m in,” over a given period. They might not be paying yet, but they’ve taken the first step.
Sign-ups tell you how well your marketing is working, how appealing your offer looks, and whether your acquisition channels are actually delivering. If this number is weak, you’ve got a visibility or appeal problem. If it’s strong but revenue isn’t moving, you’ve got a conversion problem.
Track it, break it down by source, and watch how changes in campaigns, messaging, or product positioning impact the flow.
Total number of sign-ups = Number of new users registered during the specified period
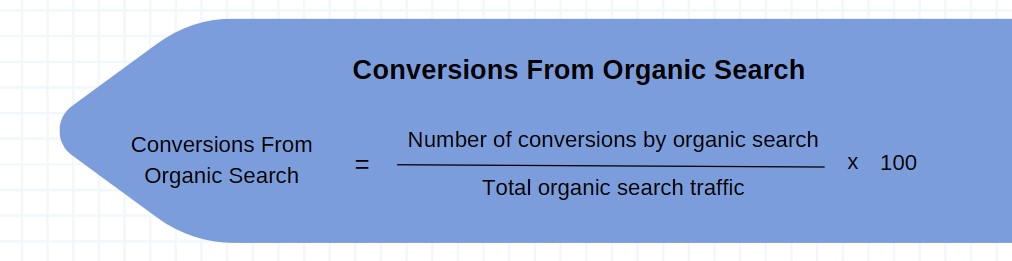
3. Conversions From Organic Search
This is where SEO proves its worth. It’s the number of visitors who didn’t just land on your site from Google—they actually did something valuable: signed up, filled out a form, or swiped their card.
Why care? Because ranking for random keywords is useless if those visitors bounce faster than they arrived. This KPI tells you if your organic traffic is the right traffic—people with intent, not just curiosity.
If the number’s low, it’s a sign your SEO is attracting the wrong crowd or your landing pages aren’t converting. If it’s high, double down—you’ve found a channel that prints money without paying for clicks.
Conversions from Organic Search = (Number of conversions by organic search / Total organic search traffic) x 100
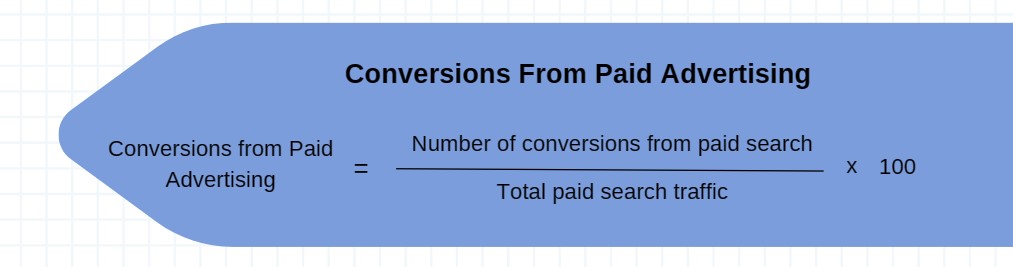
4. Conversions From Paid Advertising
This is your “did the ads actually work?” metric. It counts the actions people take after clicking your ad—buying, signing up, or filling out a form.
It’s the clearest way to see if your paid search budget is pulling its weight. If conversions are high, your targeting and messaging are on point. If they’re low, you’re either aiming at the wrong audience, writing weak ad copy, or sending clicks to a landing page that can’t close.
Track it religiously. Every wasted click is money you’ll never get back.
Conversions from Paid Advertising = (Number of conversions attributed to paid search / Total Paid Search Traffic) x 100
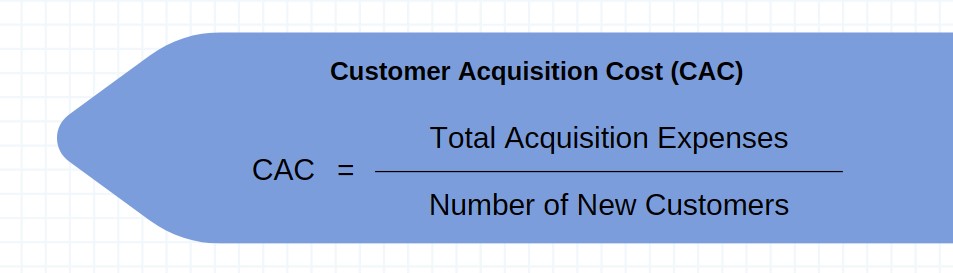
5. Customer Acquisition Cost (CAC)
CAC is the price tag on every new customer you bring in. You calculate it by taking your total sales and marketing spend for a period and dividing it by the number of new customers you got in that same period.
Why does it matter? Because if you’re spending more to get a customer than they’ll ever pay you, you’re digging a hole instead of building a business.
Keeping CAC in check tells you if your marketing is efficient, your sales process is working, and your growth is actually profitable—not just impressive on paper.
CAC = Total Acquisition Expenses / Number of New Customers
6. Customer Retention Rate (CRR)
CRR is your loyalty score. It’s the percentage of customers who stick with you over a given period instead of disappearing into the churn void.
Why it matters: New customers are expensive. Retained customers are profitable. A high retention rate means you’re delivering value, building trust, and giving people zero reason to leave.
If CRR starts slipping, something’s off—maybe your product’s losing its edge, competitors are offering better deals, or your customer experience needs a tune-up. Ignore it, and you’ll spend all your time (and money) replacing the customers you already have.
CRR = [(E – N)/S] x 100,
Where,
E = number of customers at the end of the time period.
N = number of customers gained within the time period.
S = number of customers at the start of the time period.
For example, you have 150 customers at the start of the month. You gain 30 new customers and lose 10 customers till the end of the month. So, you now have 170 customers at the end of the month.
CRR = [170 – 30 / 150] x 100 = 93.33%
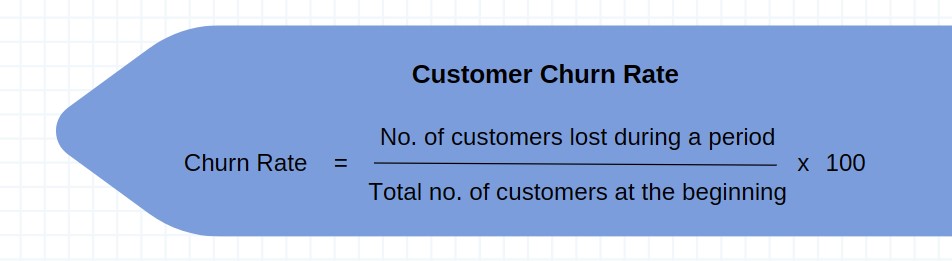
7. Customer Churn Rate
Churn rate is the flip side of retention—it’s the percentage of customers who bail on you in a given period. Monthly, quarterly, yearly… however you track it, it’s the “leaky bucket” number.
A high churn rate is a flashing red light. It means people are leaving because they’re unhappy, not seeing value, or finding a better option elsewhere.
Lowering churn isn’t just nice—it’s survival. Plug the leaks, and every new customer you win actually adds to your growth instead of just replacing the ones who left.
Churn Rate = (No. of customers lost during a period / Total no. of customers at the beginning) x 100
8. Customer Lifetime Value (CLV or LTV)
CLV is the total revenue you can expect from a customer before they churn. It’s shaped by how often they buy, how much they spend, and how long they stick around.
Why it matters: CLV tells you exactly how much you can afford to spend to win—and keep—a customer. If your CLV is high, you can outspend competitors on acquisition. If it’s low, you need to either raise prices, increase retention, or sell more to the same customers.
Get this number wrong, and your growth strategy is just guesswork.
CLV = Average Customer Value x Average Customer Lifespan
9. Monthly Recurring Revenue (MRR)
MRR is the lifeblood of any subscription business—the predictable revenue you bring in every month from paying customers. It includes recurring charges, discounts, and add-ons, but leaves out one-time payments.
Why it matters: MRR shows you how healthy and stable your business really is. If it’s growing steadily, you’re stacking predictable income. If it’s flat or dipping, your growth engine needs work—whether that’s fixing churn, improving upsells, or boosting new sign-ups.
Track it like a hawk. It’s the clearest window into your SaaS growth trajectory.
MRR = Total Number of Subscribers x Average Revenue per Subscriber per month
10. Annual Recurring Revenue (ARR)
ARR is your big-picture subscription number—the total predictable revenue you expect to pull in over a year from paying customers. It’s just your MRR multiplied by 12, with all the one-off sales and variable income stripped out.
Why it matters: ARR shows the scale of your subscription business in the clearest way possible. Investors love it, teams rally around it, and it gives you a north star for long-term growth.
If ARR isn’t moving up and to the right, neither is your company.
ARR = MRR x 12

11. Net Promoter Score (NPS)
NPS is the quick-and-dirty way to measure customer loyalty. You ask one question: “How likely are you to recommend us to a friend or colleague?” They answer on a scale from 0 to 10.
Promoters (9–10) love you. Detractors (0–6) don’t. Subtract the percentage of Detractors from the percentage of Promoters, and you get your NPS.
A high NPS means customers aren’t just satisfied—they’re willing to put their reputation on the line to recommend you. A low one? Time to dig into what’s broken before they start recommending your competitors instead.
NPS = % of Promoters – % of Detractors
12. Customer Satisfaction Score (CSAT)
CSAT measures how happy your customers are—straight from the source. You ask them to rate their experience through surveys, feedback forms, or quick “How did we do?” prompts.
A high score means you’re delivering what they want (and maybe even more). A low score is a neon sign pointing to where you’re dropping the ball.
It’s simple, fast, and brutally honest. If you’re not tracking CSAT, you’re guessing about customer happiness—and in SaaS, guessing is expensive.
To calculate the percentage of satisfied customers,
CSAT = Total no. of customers who are ‘very satisfied’ or ‘satisfied’ / Total no. of responses

The KPIs That Actually Move Your SaaS Business
Dashboards don’t grow SaaS companies; decisions do. And the only numbers worth tracking are the ones that change how you act. The 12 KPIs we covered aren’t vanity stats; they’re the signals that reveal whether your SaaS business is truly growing or quietly leaking revenue.
Ignore them, and you risk chasing traffic and signups while churn rises, CAC balloons, and MRR stalls. But when you consistently track the right KPIs, growth becomes clearer. You’ll know exactly what’s working, what’s broken, and where to focus next.
Set a baseline for each KPI, review them regularly, and act on what the data shows. The SaaS companies that win in 2026 aren’t the ones tracking the most numbers; they’re the ones using the right ones to make smarter moves.
Also read about SaaS Metrics – 18 Important Metrics SaaS Companies Should Care About