
If you’re running a SaaS company in 2026, you’re flooded with metrics: MRR, CAC, LTV, churn, and NRR. But more numbers don’t mean better decisions. Most founders aren’t short on data. They’re short on clarity about which numbers actually matter.
The best SaaS operators focus on metrics that answer three questions: Are we acquiring customers profitably? Are they getting real value? Is growth compounding or leaking? If a metric doesn’t help you act on one of these, it’s just dashboard decoration.
So forget the vanity stats. Pageviews, followers, and raw signups won’t build a durable SaaS business. What will? The handful of metrics that directly drive revenue, retention, and real growth in 2026.
What Are SaaS Metrics?
SaaS metrics are the core numbers that show how your subscription business is actually performing. Not just revenue but the drivers behind it. They tell you whether you’re growing efficiently, burning cash to buy growth, or quietly heading toward a retention problem.
If you’re only watching top-line revenue, you’re flying blind. The right metrics reveal what’s really happening under the hood: how much it costs to acquire customers, how long they stay, how much they’re worth, and whether your growth is sustainable.
In short, SaaS metrics are your operating system for decision-making. They tell you when to scale marketing, when to fix churn, and when to rethink pricing before small leaks turn into expensive problems.
Why Should You Track SaaS Metrics?
Let’s be honest, 2026 isn’t the growth-at-all-costs era. Capital is tighter, competition is fiercer, and customers switch tools faster than ever. The right SaaS metrics keep you grounded. They show what’s actually driving growth, what’s quietly hurting retention, and where you’re wasting money.
Metrics also create alignment. They help your team focus on what matters, give investors confidence, and make your strategy measurable, not emotional. If you can’t clearly explain your numbers, scaling becomes guesswork.
At the end of the day, SaaS metrics are your scoreboard. And serious operators don’t build companies blindfolded.
18 Most Important SaaS Metrics to Track
Let us now dive into the broad classification of SaaS metrics and understand the role each of them play.
Customer Acquisition Metrics
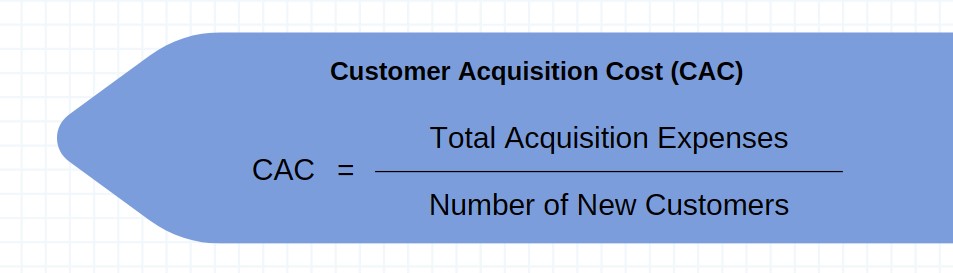
1. Customer Acquisition Cost (CAC)
CAC is what it costs to win a new customer. Take everything you’re spending on sales and marketing ads, tools, salaries, the whole deal. Then divide it by the number of new customers you brought in. That’s your Customer Acquisition Cost. If it’s too high, you’re not building a business. You’re buying growth on a credit card.
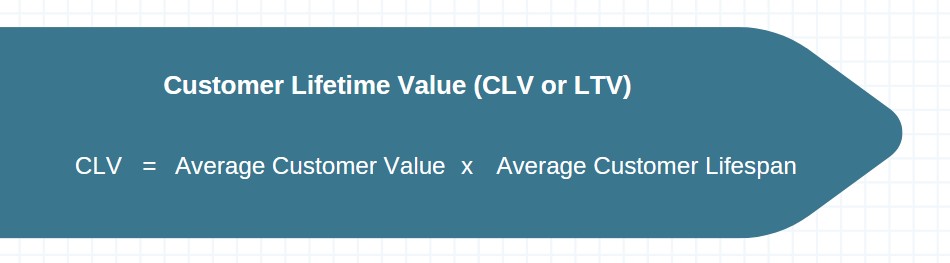
2. Customer Lifetime Value (CLV or LTV)
CLV tells you how much money you can expect to make from a single customer over the long haul. It’s the average revenue per customer, start to finish. LTV takes it a step further and shows you the total value of all your customers combined.
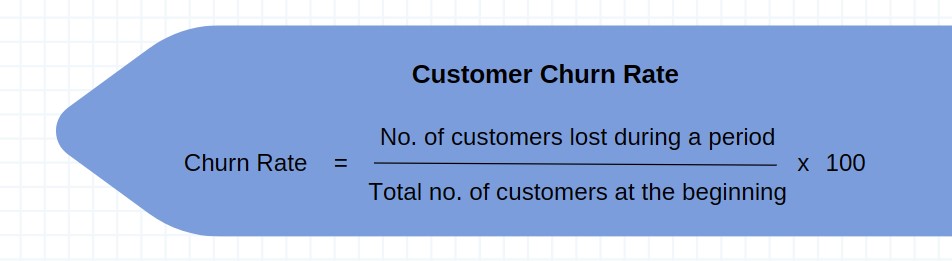
3. Customer Churn Rate
Churn Rate shows how many customers you’re losing over time. Simple as that. It’s the percentage of people who stop paying or using your product. You can track it monthly, yearly, weekly, whatever makes sense for your business. If this number’s creeping up, something’s broken. Fix it fast.
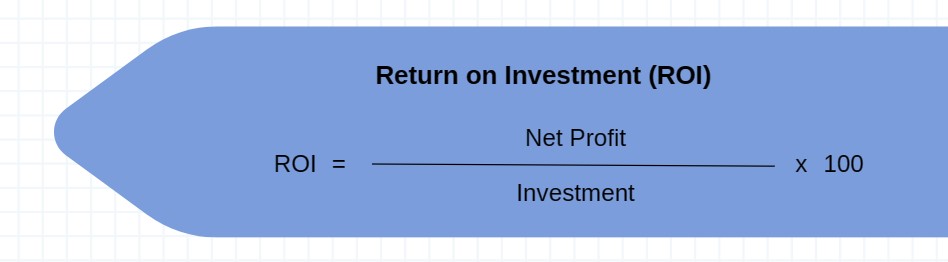
4. Return on Investment (ROI)
ROI tells you if something’s worth the money. It measures how much profit you made compared to what you spent. Take your net profit, divide it by the cost, and boom, you’ve got your ROI as a percentage. If it’s not positive, you’re lighting cash on fire.
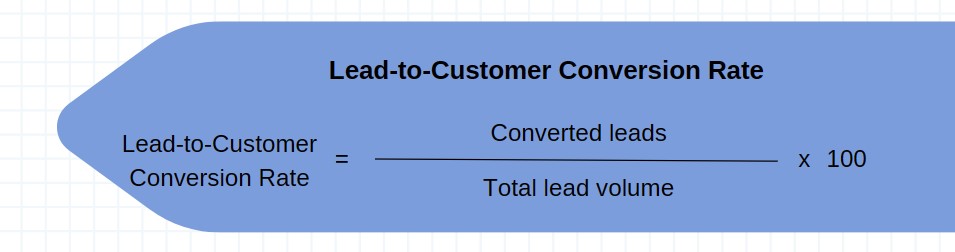
5. Lead-to-Customer Conversion Rate
Lead-to-Customer Conversion Rate shows how good you are at turning leads into paying customers. It’s the percentage of leads that actually buy. High rate? Your sales and marketing are doing their job. Low rate? You’re either attracting the wrong people or dropping the ball during the pitch.
Customer Engagement Metrics
6. Customer Satisfaction Score (CSAT)
Customer Satisfaction Score (CSAT) tells you how happy your customers are with your product or service. Usually, it’s a quick survey or rating after an interaction. The higher the score, the better you’re doing. If it drops, it’s a sign something’s off, and it’s your cue to fix it before churn creeps in.
To calculate the percentage of satisfied customers,

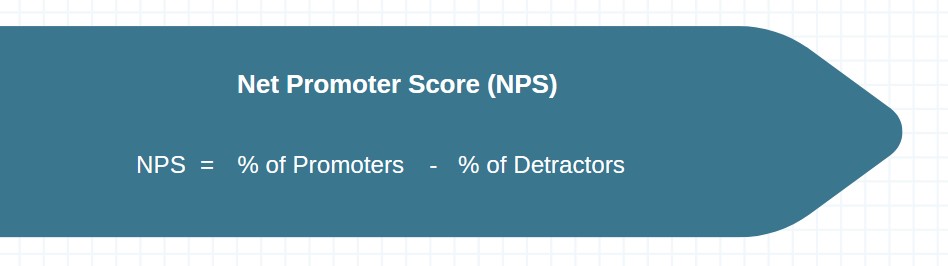
7. Net Promoter Score (NPS)
NPS measures how likely your customers are to recommend you. It’s one simple question: “How likely are you to recommend us, from 0 to 10?” Promoters (9–10) love you. Detractors (0–6) don’t. The more promoters you have, the stronger your brand loyalty and the less you have to spend on winning new customers.
Subtracting Detractors from Promoters yields the NPS, a gauge of overall customer satisfaction and loyalty.
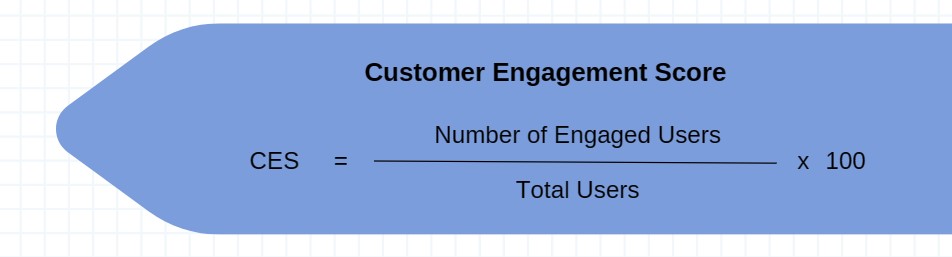
8. Customer Engagement Score
Customer Engagement Score shows how involved your users really are. It looks at things like how often they log in, which features they use, and whether they give feedback. The higher the score, the more likely they’ll stick around. Low score? That’s a red flag they might churn soon.
Customer Retention Metrics
9. Customer Retention Rate
Customer Retention Rate tells you how many customers are sticking with you over time. It’s shown as a percentage of people who stayed loyal during a set period. If this number is high, you’re doing something right. If it’s low, you’ve got a leak to fix.
CRR = [(E – N) / S] x 100,
Where,
E = number of customers at the end of time period.
N = number of customers gained within the time period.
S = number of customers at the start of time period.
For example, you have 130 customers at the start of the month. You gain 20 new customers and lose 5 customers till the end of the month. So, you now have 145 customers at the end of the month.
CRR = [145 – 20 / 130] x 100 = 96.15%
10. Repeat Purchase Rate (RPR)
Repeat Purchase Rate (RPR) shows what percentage of your customers come back to buy again. If someone makes a second purchase later on, they count as a repeat buyer. The higher this number, the better you’re doing at keeping people interested after the first sale.

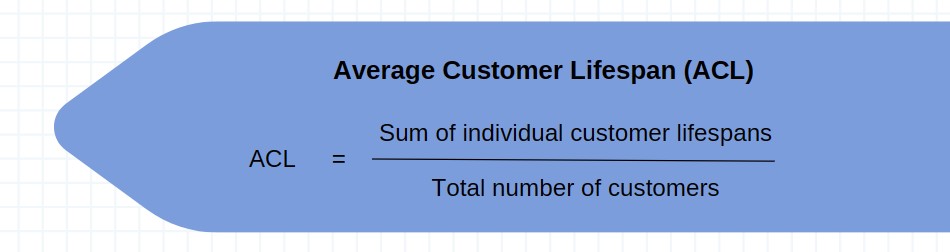
11. Average Customer Lifespan (ACL)
Average Customer Lifespan (ACL) tells you how long a customer sticks around before they churn. It’s a key part of calculating CLV because the longer someone stays, the more value they bring to your business.
Growth Metrics
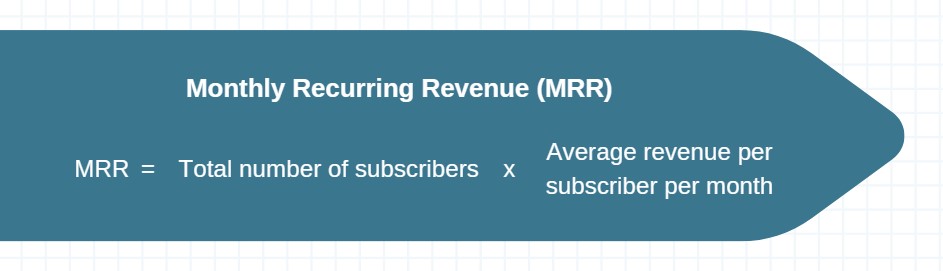
12. Monthly Recurring Revenue (MRR)
Monthly Recurring Revenue (MRR) is the steady income you bring in every month from subscriptions. It includes things like discounts, coupons, and recurring add-ons. One-time fees don’t count. If you want predictable growth, this is the number to watch.
13. Annual Recurring Revenue (ARR)
Annual Recurring Revenue (ARR) is your subscription revenue stretched across a full year. It’s the yearly version of MRR and helps you get a clear view of long-term growth. If you’re selling subscriptions, this is one of your most important numbers.

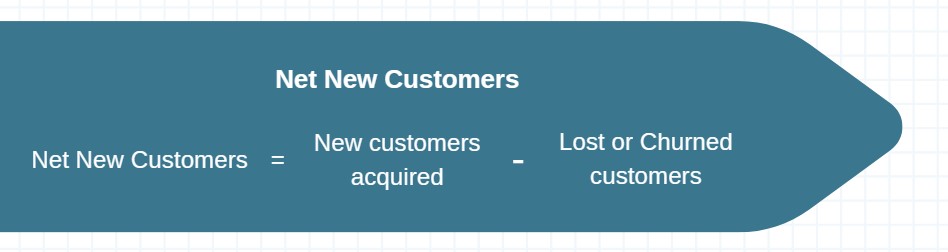
14. Net New Customers
Net New Customers shows how many new customers you actually gained after subtracting the ones you lost to churn. It tells you if you’re growing or just replacing what’s leaking out the bottom.
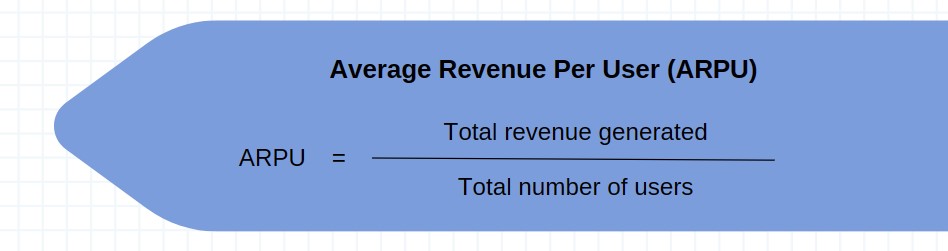
15. Average Revenue Per User (ARPU)
ARPU stands for Average Revenue Per User. It tells you how much revenue you’re making per customer over a set period. It’s a quick way to see if you’re getting more value out of each user or leaving money on the table.
Economics Metrics
16. LTV-to-CAC Ratio
The LTV : CAC ratio is a key startup / SaaS business metric used to measure whether a company’s customer acquisition strategy is profitable and sustainable.
LTV to CAC ratio = LTV/CAC
Ideally, the ratio should be 3:1, which means the company should make 3 times the revenue spent on acquiring a customer.
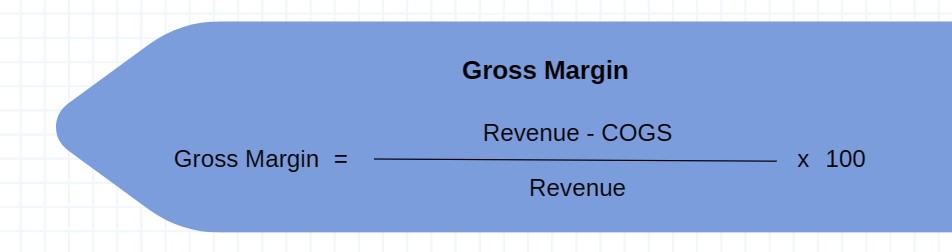
17. Gross Margin
Gross margin shows how much revenue you keep after covering your core costs like labor and materials. Higher margin means more money to reinvest into growth.
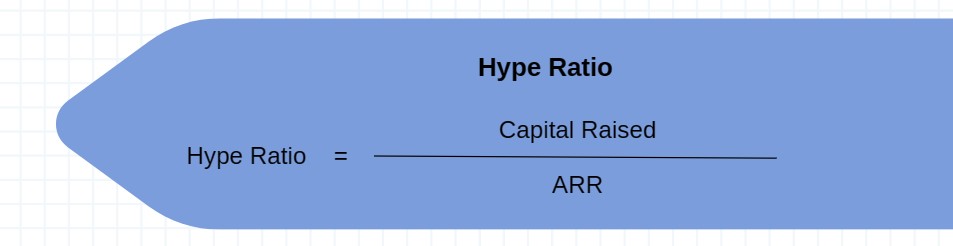
18. Hype Ratio
The Hype Ratio, also known as Burn Multiple, shows how well you’re turning investor cash into ARR. If you’re raising money, this metric matters. It tells whether you’re just raising hype or actually building something that brings in real revenue. The best SaaS companies turn capital into ARR, not just headlines.
19. Net Revenue Retention (NRR)
Net Revenue Retention (NRR) is a SaaS metric that measures how much recurring revenue from existing customers you retain over a period after accounting for upgrades, downgrades, and churn.
Formula:
Which SaaS Metrics Matter Most at Different Stages?
Not every metric is equally important at every stage. Here’s a cheat sheet:
- Early-Stage (Pre-product/market fit): Activation, MAU, stickiness. Are people actually using (and loving) your product?
- Growth-Stage: MRR, CAC, LTV, churn. Are you making money and growing efficiently?
- Late-Stage: NRR, GRR, expansion revenue. Is your revenue base strong and growing without relying only on new customers?
Focus on the numbers that match your current priorities, not just what’s trendy.
Vanity Metrics: What Not to Obsess Over
Not every shiny number deserves your attention. Vanity metrics look good in a tweet but often mean nothing for real growth.
- Total sign-ups: If 90% never convert, who cares?
- Page views: Unless tied to product usage, this is just noise.
- Social followers: Fun for your ego, but your bank account doesn’t care.
Stick to metrics that connect to revenue or customer happiness. Everything else is just a distraction.
How these SaaS Metrics Impact your Business
Tracking SaaS metrics isn’t about spreadsheets; it’s about smarter decisions in pricing, retention, marketing, and finance. The right numbers don’t just measure performance; they drive strategy. Here’s how focusing on what truly matters in 2026 transforms each area.
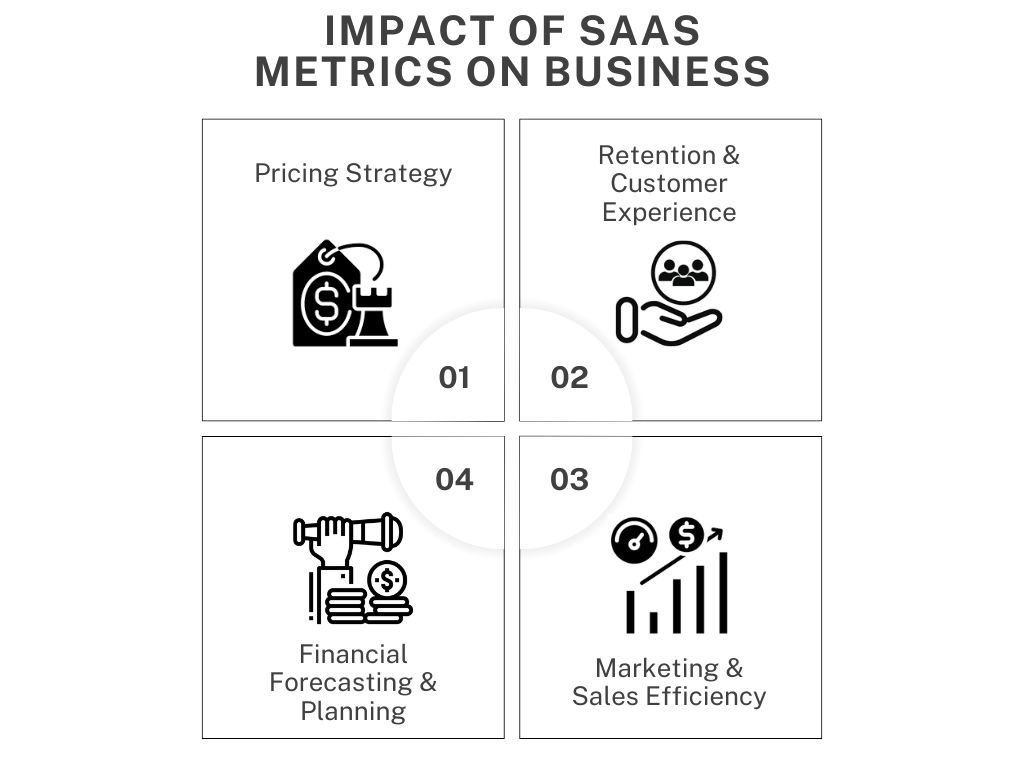
Pricing Strategy
Your pricing shouldn’t be based on gut feeling. Tracking ACV (Average Contract Value), LTV (Customer Lifetime Value), and gross margin shows which plans generate real profit, not just revenue. You’ll quickly see which tiers attract high-value customers and which ones drain support resources. This data lets you optimize packaging, test price increases confidently, and protect margins while scaling.
Retention & Customer Experience
Growth means nothing if customers don’t stick around. Churn rate tells you how fast revenue leaks out. NPS (Net Promoter Score) shows how customers actually feel about your product. Together, they reveal whether problems stem from onboarding gaps, weak product-market fit, or poor support. Fix retention early, and compounding growth becomes possible.
Marketing & Sales Efficiency
Customer Acquisition Cost (CAC) shows how much you’re spending to win a customer. The payback period tells you how long it takes to recover that investment. If payback drags on too long, growth becomes expensive and risky. In 2026, efficient SaaS teams scale channels where CAC is predictable and payback is fast.
Financial Forecasting & Planning
MRR (Monthly Recurring Revenue), ARR (Annual Recurring Revenue), and NRR (Net Revenue Retention) give you a clear view of predictable income. They show how renewals, upgrades, downgrades, and churn impact future growth. With these metrics dialed in, leadership can forecast confidently, allocate budgets wisely, and invest in expansion without guessing.
Real-World SaaS Metric Benchmarks for 2026
You’re probably wondering: “What’s a good number for X?” Let’s look at some recent benchmarks:
- MRR Growth: Top SaaS companies see 15-20% monthly growth in the early stage.
- Churn Rate: Less than 1% monthly churn is ideal for B2B SaaS.
- CAC Payback: Under 12 months is strong; 12–18 months is best-in-class.
- Net Revenue Retention: 120%+ is typical for leading SaaS companies.
- Gross Margin: 60–70% is the sweet spot for most SaaS businesses.
Remember, these are just reference points. Your exact numbers will depend on your market, pricing, and growth stage. But if your metrics are way off these marks, dig deeper—you might have a hidden problem.
Take Action: Start Tracking Your SaaS Metrics Today
In 2026, “going with your gut” isn’t a strategy. The SaaS companies that win know their numbers cold. Whether you’re a two-person startup or a 200-person scale-up, clarity beats optimism every time. Metrics don’t slow you down; they remove guesswork.
Don’t overcomplicate this. You don’t need 20 KPIs. Pick three that matter most at your current stage. Early stage? Focus on activation, CAC, and churn. Scaling? Watch NRR, payback period, and LTV: CAC. The goal isn’t more tracking, it’s better decisions.
Start today. Open your dashboard. Define your core metrics. Review them weekly. Because in SaaS, the companies that measure what matters are the ones that compound growth while everyone else just hopes for it.
Conclusion
SaaS metrics aren’t “finance stuff.” And they’re definitely not just for investor decks. In 2026, they’re your daily feedback loop. They tell you clearly and without emotion whether your product is creating value, your growth is sustainable, and your cash flow is healthy. Ignore them, and small cracks turn into expensive problems.
When you know what to track (and what to ignore), everything gets sharper. You catch churn before it compounds. You double down on acquisition channels that actually pay back. You fix onboarding before it tanks retention. Metrics don’t just report history, they shape smarter moves.
So the next time someone starts throwing acronyms around in a meeting, you won’t just nod along. You’ll understand exactly what they mean, which ones matter, and how they connect to real growth. And that’s how durable SaaS companies are built in 2026.
Also read about SaaS KPIs – 12 SaaS KPIs Every Company Should Track